Petascale Analysis of Electron Microscopy Images of the Nervous System
 |
|---|
| Electron Microscopy of Neural Ultrastructure |
One cubic millimeter of cerebral cortex contains roughly 50,000 neurons, each of which establishes approximately 6,000 synapses with neighboring cells (Beaulieu and Colonnier 1983). These 300,000,000 interconnections are highly specific: neurons innervate some target cells but avoid others. Of course, a cubic millimeter is but a miniscule part of the full circuitry, which is estimated to contain 60x1012 synaptic connections. Determining the detailed connections in brain circuits is a fundamental unsolved problem in neuroscience. Understanding this circuitry will enable brain scientists to confirm or refute existing models, develop new ones, and come closer to an understanding of how the brain works.
Recent advances in electron microscopy imaging now provide the capability to image the ultrastructure of the brain at unprecedented resolution with extremely large volumes of interest (Denk and Horstmann 2004; Briggman and Denk 2006; Blow 2007; Micheva and Smith 2007), with several types of E-M providing a 3D volumetric resolution of 50 nm x 50 nm x 50 nm = 125000 nm3 over regions of up to a cubic millimeter. Full imaging of a cubic millimeter of tissue, 1x1x1 mm3 =1000 x 1000 x 1000 micrometers3 = 1000000 x 1000000 x 1000000 nanometers3 with cubic voxels of size 50 nm x 50 nm x 50 nm will create images of 8 petavoxels.
Advances in imaging devices have continued to increase the resolution of voxels to smaller sizes, acquiring even larger images with more voxels, and enabling automated capture of larger regions. Visualizing and interpreting this data continues to be a challenge.
These advances in image acquisition have not yet been matched by advances in algorithms and implementations that will be capable of enabling the analysis of neural circuitry. Recent reviews have identified the development of appropriate informatics tools as the primary requirement for new success in understanding the connectivity of the brain (Smith 2007). The need for sophisticated algorithms capable of enabling the analysis and interpretation of petascale E-M data is a pressing problem in computational biology.
The primary challenges are 1) the robust alignment of high resolution images of 2D slices of neural tissue to construct three dimensional volumes, 2) interactive visualization of volumetric petascale data, 3) automatic segmentation of neural structures such as axons and synapses to define neural circuit elements, and 4) network analysis to enable the comparison of neural circuits.
Volumetric Electron Microscopy Images from Serial Sections
Our work focused on the development of an algorithm for the creation of volumetric electron microscopy data from serial sections. We have developed a scalable algorithm that is not limited by the memory or computational capacity constraints of individual workstations, and is able to take advantage of compute clusters to process data of arbitrary size.
The alignment of serial sections is a powerful way of enabling three-dimensional analysis of neural ultrastructure. 3D reconstruction from serial 2D images depends on non-linear alignment of serial sections. Our approach to deal with the non-linear alignment of arbitrarily large 2D images uses the finite support properties of cubic B-splines.
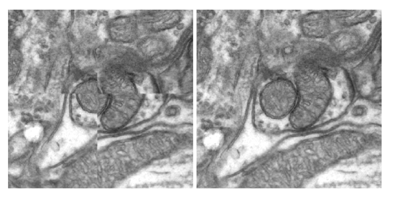 |
|---|
| Illustration of alignment before (left) and after (right) compensation for nonrigid distortion in 10kx10k Electron Microscopy images |
After initial affine alignment, each large image is split into a grid of smaller overlapping sub-images, which are individually registered using cubic B-splines transformations. Inside the overlapping regions between neighboring sub-images, the coefficients of the knots controlling the Bsplines deformations are blended, to create a virtual large grid of knots for the whole image. The sub-images are resampled individually, using the new coefficients, and assembled together into a final large aligned image. We evaluated the method on a series of large transmission electron microscopy images and our results indicate significant improvements compared to both manual and affine alignment (Dauguet et al. 2007).
We developed an advanced algorithms that enabled us to accelerate the image registration which in turn allowed for the construction of 3D volumes of neural ultrastructure. The algorithm is described in this paper: Neural Ultrastructure Alignment.
References
- Beaulieu, C., and M. Colonnier. 1983. The number of neurons in the different laminae of the binocular and monocular regions of area 17 in the cat, Canada. J Comp Neurol 217 (3):337-44.
- Blow, Natahan. 2007. Following the wires. Nature Methods 4 (11):975-980.
- Briggman, K. L., and W. Denk. 2006. Towards neural circuit reconstruction with volume electron microscopy techniques. Curr Opin Neurobiol 16 (5):562-70.
- Dauguet, J., D. Bock, R. C. Reid, and S. K. Warfield. 2007. Alignment of large image series using cubic B-splines tessellation: application to transmission electron microscopy data. Med Image Comput Comput Assist Interv Int Conf Med Image Comput Comput Assist Interv 10 (Pt 2):710-7.
- Denk, W., and H. Horstmann. 2004. Serial block-face scanning electron microscopy to reconstruct three-dimensional tissue nanostructure. PLoS Biol 2 (11):e329.
- Micheva, K. D., and S. J. Smith. 2007. Array tomography: a new tool for imaging the molecular architecture and ultrastructure of neural circuits. Neuron 55 (1):25-36.
- Smith, S. J. 2007. Circuit reconstruction tools today. Curr Opin Neurobiol 17 (5):601-8.
- Akselrod-Ballin, A., D. Bock, R. C. Reid, and S. K. Warfield. IEEE TMI. 2011. DOI: 10.1109/TMI.2011.2125797